A Summary of the Most Recent Firearms Fatality Data
Without editorializing, and presented as just the facts.

Just who dies from guns in America? When looking at fatalities from firearms, if you’re going to get anything useful from the data, you have to think in terms of an insurance actuary. Why do young males pay higher rates for car insurance? Why does anyone under 30 pay more? In both cases, it is because of their particulars. For adolescent men, it’s their risk-taking behaviors (postscript), and those under 30 are more likely to drink and drive. The same probabilistic logic goes for gun deaths, which vary considerably by age, race, sex, and particular circumstances of the death – suicide, homicide, via law enforcement, or by accident. One should then look at where those deaths occur, at least at the state level. Finally, the best question we always need to ask is “compared to what?” How do firearms deaths compare to other types of death?
Granted, if you’re coming at the data with an “all guns are bad” perspective, it doesn’t make much emotional sense to parse the data and compare it to anything. If you’re coming at the data trying to see if there are policies that might exist to reduce deaths from guns, then it does make sense to parse the data. Low hanging fruit don’t really exist in the policy world, but then again, not everything is a moon shot either.
To prevent cherry-picking, I’m using 2023 data across the board. Sources are at the bottom of this post, rather than linked, keeping this uncluttered.
So, how many people die from gunshot wounds in America in any given year? According to the CDC in 2023 there were 46,728.
The biggest chunk of firearms deaths are suicides, at 27,300 (58%). Suicides have long accounted for the majority of gun deaths in America and 55% (27,300 out of 49,316), of all suicides in 2023 involved a gun.
The next major source of firearms deaths is homicides, at 17,927 (38%) for the 2023 data. As for the how many murders involve guns, that’s 17,927 out of 22,830, or 79%. About 90% of gun murders are with handguns.
The remaining gun deaths were from some sort of law enforcement involvement at 604 (1.2%), accidental (1%) or other circumstances 434 (0.9%). This last category makes little sense, until you remember that FBI crime data is voluntarily submitted, and many locations are increasingly opting out or providing incomplete information, and self-defense data is not regularly noted.
There were 3,279,857 deaths in 2023. By comparison to guns, heart disease, the Grim Reaper’s favorite, killed 680,981, followed by cancer with 613,352, then accidents at 222,698.
The number of deaths by firearms ranks about the 9th leading cause of death, which is chronic liver disease and cirrhosis at 52,222 in 2023. Between alcohol and fatty liver disease, firearms are a more rapid but just as deadly way to die as is drinking too much.
By race in 2023, firearms deaths were 31,766 whites and Hispanics, 13,062 blacks, 661 Asians, 557 natives and 551 multi-racial deaths. As has been pointed out many times, the black population (in 2023) was 14.4% of the populace, living primarily in the South, and they make up a disproportionate 28% of firearm deaths.
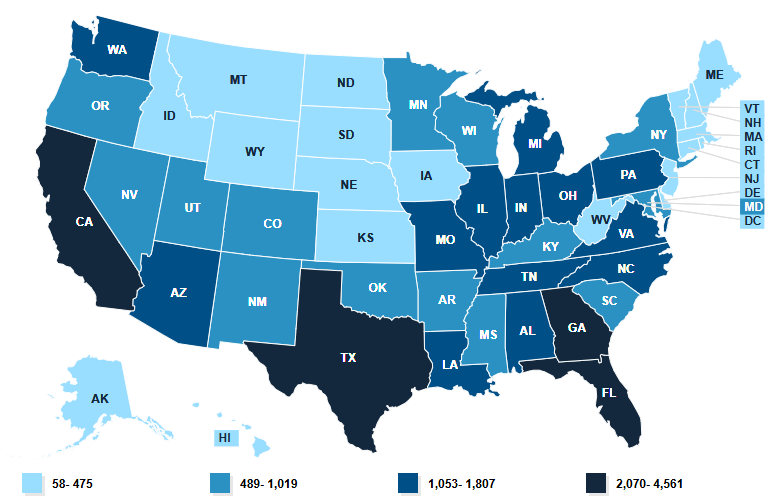
Here’s a heat map image of 2023 firearms deaths. The top 4 are Texas at 4,681, then Florida at 3,253 and then California 3,209 and Georgia at 2,070. It’s no surprise that the states with the largest populations, and with large populations of blacks, and those of lower socio-economic status, would have the highest number of firearms deaths.
For a slightly different picture, here is the same data per capita.
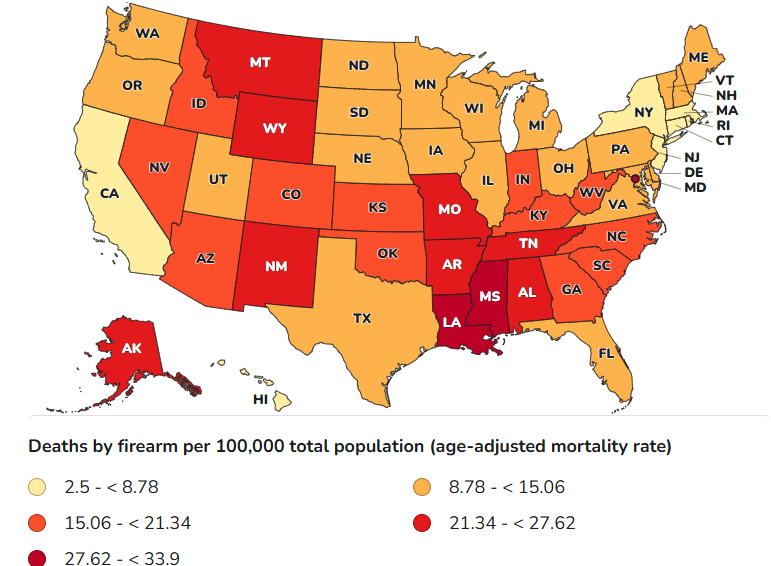
You still see the black belt with a high number of deaths per 100,000, but when looking at the data this way it makes high population California look better and low population and low crime but high gun ownership states like Montana look worse, due to suicides.
Here’s a specific example of how this works: While two states might have similar gun death rates, the type of gun violence driving that rate can differ entirely. Maryland (12.3 per 100,000) and South Dakota (12.3 per 100,000), for instance, have similar overall age-adjusted gun death rates. Yet, 63% of gun deaths in Maryland were homicides (because of high crime Baltimore) while in South Dakota, only 10% were homicides.
As for a trend graph, the number of deaths spiked recently after holding steady for many years. I’m not cherry-picking, because the trend before 2018 was relatively flat going back to about 2000. Only looking at the last few years and we can see the de-policing trend of 2020 and the post-BLM world in 2021 making considerable change, with a 23% increase between 2019-2021, before starting to decline again as the pendulum has swung back in favor of “law and order” even if we are not back to the pre-BLM era. America is sitting at late 1980s and early 1990s New Jack City crack epidemic era numbers of gun murders.
2018: 39,740
2019: 39,687
2020: 45,221
2021: 48,830
2022: 48,204
2023: 46,728
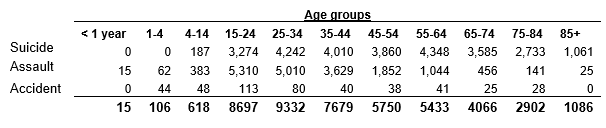
As for the ages of those killed by guns…try getting this data in a clean chart is very difficult, if not impossible, since how you parse this data says as much as what you’re intending to use it for as anything else. If you want a high count to scare people with how many “teens” are killed with guns, you go about including someone who is 19 as a “teen” (which is technically correct, the best kind of correct).
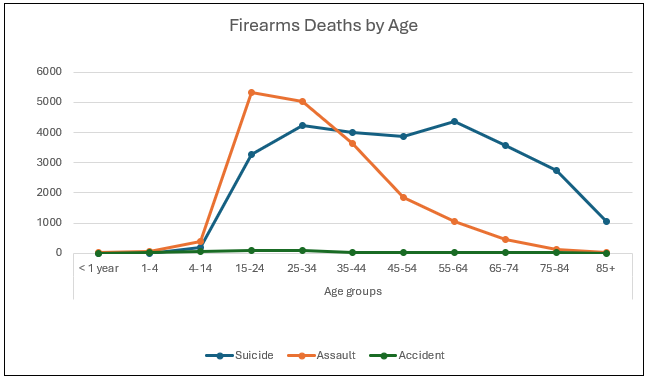
Clearly, gun deaths are more of a male problem, males account for more than 85% of all gun deaths, regardless of suicide, accident, or “assault” as this dataset shows. For females, it was 4,593 suicides, 3,007 murders, and 57 accidents. For males, the numbers are starkly higher, with 23,707 suicides, 14,920 murders, and 406 accidents.
Lastly, here is a succinct distribution chart of gun deaths by age, that shows a skew to the middle years.
That’s the most recent firearm fatality data, as best as it can be presented with minimal editorial commentary. The observations of these data has contributed to gun control efforts from several angles. Whereas most gun control for the history of the movement was an effort to prevent homicides, there is a notable change in recent years with a somewhat good faith effort to do something about the biggest issue, suicide. The policies gun control organizations are pushing to help with suicides, such as safe storage laws, restricting the purchases of firearms from private individuals (universal background checks) and extreme risk protection order laws, all have associated trade-offs. There is admittedly very little good will between gun rights and gun control organizations, so any of these efforts are looked at as a camel’s nose under the tent.
Sources:
Pew Research: What the data says about gun deaths in the U.S.
https://www.pewresearch.org/short-reads/2025/03/05/what-the-data-says-about-gun-deaths-in-the-us/
CDC. Deaths: Leading Causes for 2023
https://www.cdc.gov/nchs/data/nvsr/nvsr74/nvsr74-10.pdf
CDC. Mortality in the United States, 2023
https://www.cdc.gov/nchs/data/databriefs/db521.pdf
CDC. Leading Causes of Death, 2023
https://www.cdc.gov/nchs/fastats/leading-causes-of-death.htm
Kaiser Family Foundation, Total Deaths due to Firearms by Race/Ethnicity, 2018-2023
National Safety Council. Guns (Interactive Chart)
https://injuryfacts.nsc.org/home-and-community/safety-topics/guns/data-details/
Johns Hopkins Center for Gun Violence Solutions. Annual Gun Violence Data 2023
https://publichealth.jhu.edu/center-for-gun-violence-solutions/annual-gun-violence-data
Johns Hopkins Center for Gun Violence Solutions: New Report Highlights U.S. 2023 Gun Deaths: Suicide by Firearm at Record Levels for Third Straight Year
CDC. Firearm Mortality
https://www.cdc.gov/nchs/state-stats/deaths/firearms.html
US Dept. of Justice - Trends and Patterns in Firearm Violence, 1993–2023
https://bjs.ojp.gov/library/publications/trends-and-patterns-firearm-violence-1993-2023
Postscript:
I know something about adolescent male risk taking. At age 17 or so back in 1995, I thought it would be something to brag out to “bury the needle” on my 1985 Toyota pickup, having heard others my age claim to do so on their vehicles. I did so, spontaneously, when the opportunity presented itself, out on Cherry Valley Road, a lonely country stretch of blacktop 1 ½ lanes wide that lays just outside of Rockford, Illinois among the corn and soybean fields. I was driving, alone, along a flat stretch of several miles not too far away from the family sod farm. I cannot recall why I was there, where I was going to or coming from, but I caved into the lure of the void and gunned it. The car started to rattle at about 90 mph, but the speedometer topped out at 110 mph. Eyes quickly glancing back and forth between the road and the dial, I watched the little yellow needle creep up and hit 110, and then dip further to the right. After a brief ecstasy of success, the certainty of death should I lose control loomed large in my mind, and I let off the accelerator and the car rapidly lost momentum and got down to a normal speed. I said a prayer of thanks to God as I rested at the stop sign at the next intersection. To this day I have no idea what possessed me to be so stupid, because there was glory in this victory. The feeling stays with me 30 years later.